David Castells-Quintana, Elisa Dienesch & Melanie Krause, 2021, Ecological Economics, 189
RESEARCH PROGRAM
Population growth and global warming are two of the most pressing challenges that humanity faces in the 21st century. Increasing populations and ongoing urbanization are leading to larger and, in many cases, denser cities. One alarming side effect of urban life is air pollution, which has serious consequences on human capital, productivity and health.
The evolution of emissions per capita, together with the population density-emissions relationship, is not straightforward and is likely to depend on several factors, including income levels and demand patterns, productive technologies, and infrastructures. Conceptually, one can distinguish the Malthuasian (1798) from the Boserupian (1981) view: according to the first theory, population growth overexploits resources and raises emissions per capita. By contrast, the second holds that a growing population, due to agglomeration externalities, fosters innovation, for example in agricultural technology and energysaving. Therefore, changes in the spatial distribution of population and economic activity are likely to play a decisive role in how emissions per capita evolve.
To study the effects of density and the spatial distribution of population on emissions, we build i) a large and unique dataset for more than 1200 (big) cities around the world with data for the last two decades, and ii) a large dataset for more than 190 countries with data from 1960 to 2010. We combine data from several sources, including air quality stations around the world (CO2 and PM2.5 for robustness), national and international statistics, and satellite imagery. In particular, we use city-level data from the European Commission’s Global Human Settlement Layers (GHSL) from the Urban Centre Database and different measures of the urban form for our 1234 cities based on satellite data on night-time lights, as illustrated in Figure 1.
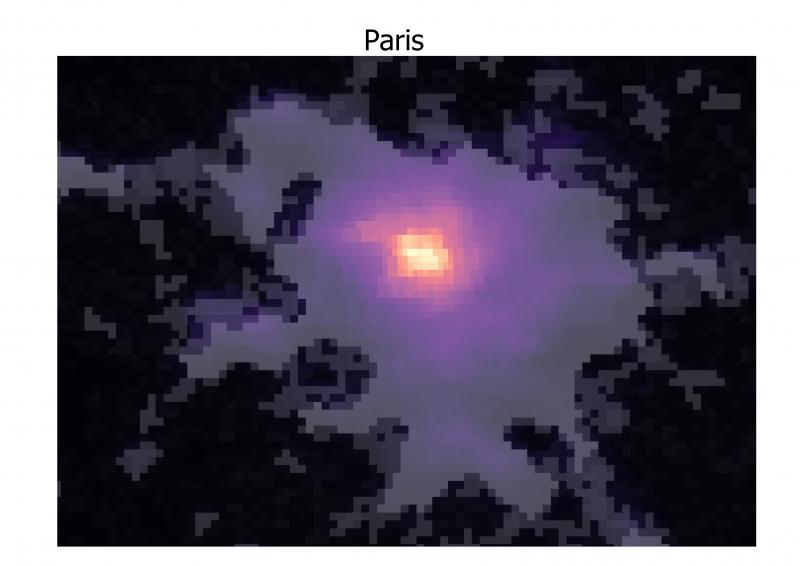
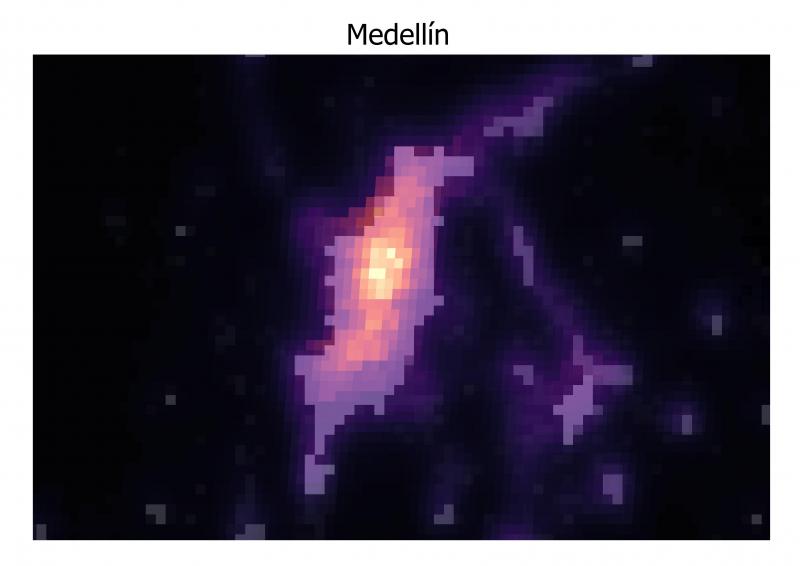
Figure 1. Night-time lights and city structure
The two pictures present maps of Paris and Medellín (Colombia), illustrating the distribution of night-time lights across the pixels of the built-up area. Night-time lights in 2013 are depicted with respect to each city’s maximum luminosity, with brighter colors (yellow, orange, red) denoting higher values and darker colors (purple, black) lower values. The urban areas of the city based on GHSL data for 2015 form the backdrop. Paris shows strong monocentricity (Moran’s I of 0.9502) while Medellín (Moran’s I of 0.7686) is rather fragmented.
We link and complement the insights obtained in our city-level analysis with an investigation at country level, paying special attention to a factor omitted from the literature to date, namely, density in urban areas. Population density in a country may differ substantially from density in urban areas. For example, Egypt has comparatively low population density overall, but very high population density in urban areas, driven by high density in its main cities such as Cairo.
PAPER’S CONTRIBUTION
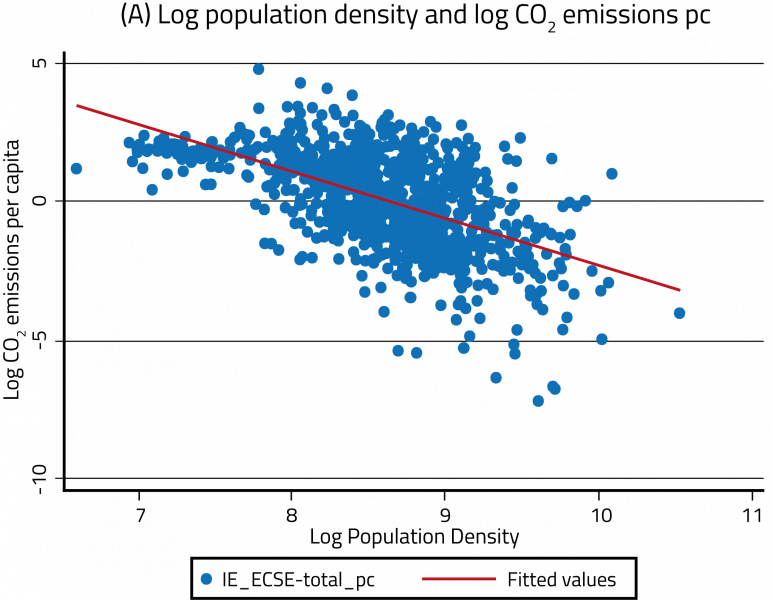
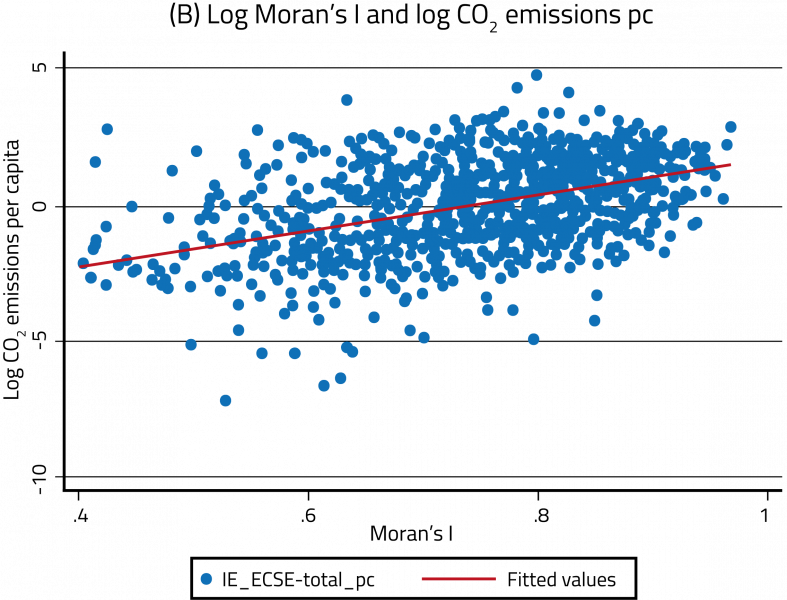
Figure 2. Scatter plots across 1328 cities for the year 2015
We document that denser cities show lower emissions per capita, as illustrated by Figure 2A. This negative relationship between city density and emissions per capita is robust to several controls, different estimation techniques and identification strategies. Using our global sample of cities, we also found evidence of the Environmental Kuznets Curve (EKC), suggesting that emissions per capita go up with income levels at early stages of development, but then decline as development proceeds. This is the first time that the EKC curve is reported in a global sample of cities.
Moreover, we find that the spatial structure of cities also plays an important role. On average, a monocentric (compact) city pollutes more than a polycentric (dispersed) one, and this is particularly true for large cities (Figure 2B). These results are consistent with the theoretical predictions of DenantBoemont et al. (2018), who propose a mechanism related to transport emissions.
Our results at city level are supported by new insights gained here at country level. While higher total population density and urbanization are associated with higher CO2 emissions per capita, the opposite applies when we look at urban population density: higher density in urban areas is associated with lower emissions per capita.
In terms of policy implications, our results suggest that policy-makers concerned with pollution should pay attention not only to population dynamics but also to the evolution of the spatial distribution of population, both at country and at city level. Based on our results, fostering denser urban areas could lead to lower emissions per capita. Similarly, as cities grow, a more spatially decentralized (i.e., polycentric) structure should be encouraged.
REFERENCE
Denant-Boemont, L., C. Gaigné, and R. Gaté (2018).
“Urban Spatial Structure, Transport-Related Emissions and Welfare.” Journal of Environmental Economics and Management, 89, 29-45.
→ This article was issued in AMSE Newletter, Winter 2021.